Blog Post Date: Aug 10th, 2020
Blog Post Updated: Sep 30th, 2020
A comparison of the Red states as a whole versus the Blue states
US states population data was uploaded this from the source below -- Wikipedia List of U.S. states by population (Dec 2019 Census)
https://simple.wikipedia.org/wiki/ListofU.S.statesby_population
Once I had the states population data, it was a simple matter to calculate cases per million and deaths per million on a state by state basis.
So, here we will look at all of the below:
- Worst performing states by cases per million
- Worst performing states by deaths per Million
- worst performing states by 1 week case growth
- worst performing states by 2 weeks case growth
- worst performing states by 4 weeks case growth
- Top states by cases
- Top states by deaths
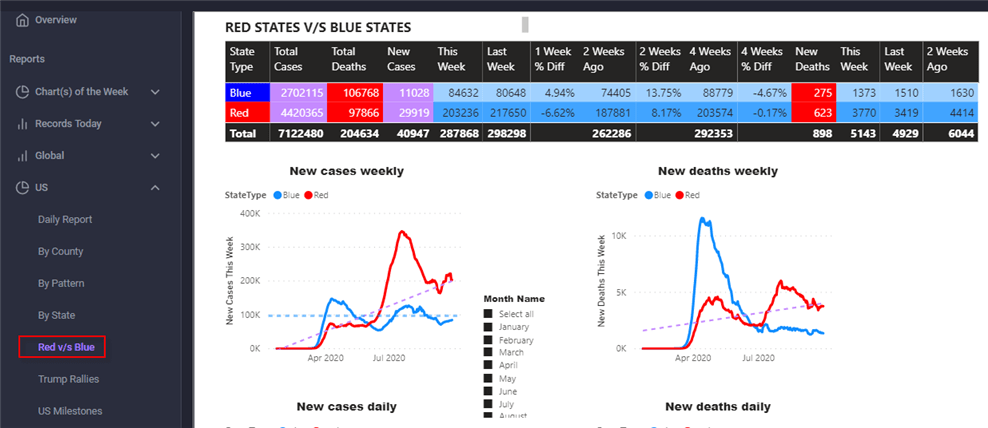
- Total Number of cases, cases per million, deaths, deaths per million in all the Red states
- Total Number of cases, cases per million, deaths, deaths per million in all the Blue states
- The gap between the cases per million between Blue and Red states - huge gap that has almost been erased in the last 4 weeks
- The gap between the deaths per million between Blue and Red states - still a huge gap, which has reduced a little in the last 4 weeks
Note
- Red states are the 30 states won by Trump in the 2016 election.
- Blue states are the 20 states lost by Trump.
- Most of the Red states didn't have a mask policy until recently or did have a mask policy and didn't enforce it and don't practice social distancing.
- Most of the Blue states have a mask policy, but may not aggressively enforce it. The Blue states also do a better job of practicing social distancing.
Relevant links to COVID Data Analytics site
Case and Death Patterns by State
https://corona-virus.dev/app/reports/cvus/cvupattern
Red States v/s Blue States
https://corona-virus.dev/app/reports/cvcow/cvwred_blue
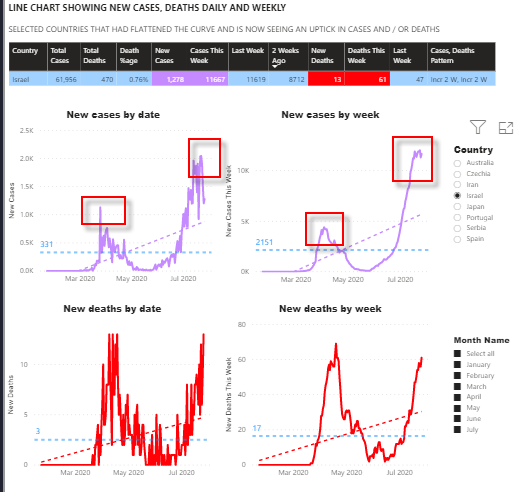
Second Wave (Israel after school re-openings)
https://corona-virus.dev/app/reports/cvglobal/cvgsecond_wave
Red States v/s Blue States summary (Sep 29th)
- July 29th: First time that the Red states have a higher Cases per million than the Blue States (John Hopkins data)
- There is still a huge gap in the deaths per million (524 to 758).
- The Red States have a significantly higher cases per million (23,664 to 19,191)
- Snapshot as of Sep 30th
| Type | Population | Total Cases | Per Million | Total Deaths | Per Million |
|---|---|---|---|---|---|
| Red | 186,794,119 | 4,450,418 | 23,825 | 98,550 | 528 |
| Blue | 140,800,676 | 2,714,515 | 19,279 | 107,020 | 760 |
| Total | 331,770,791 | 7,164,933 | 21,871 | 205,570 | 628 |
- Snapshot as of July 28th
| Type | Population | Total Cases | Per Million | Total Deaths | Per Million |
|---|---|---|---|---|---|
| Red | 186,794,119 | 2,425,716 | 12,986 | 55,405 | 297 |
| Blue | 140,800,676 | 1,836,427 | 13,043 | 91,807 | 652 |
| Total | 327,594,795 | 4,262,143 | 13,010 | 147,212 | 449 |
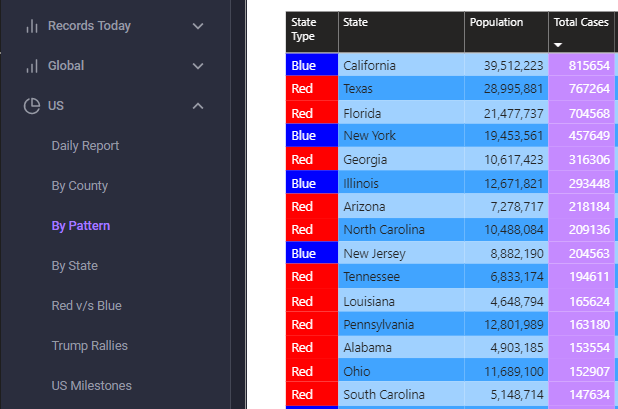
States with the Highest Number of cases
- California should be at the top for a while
- Florida and Texas should be at #2 and #3 for a while as they are growing very rapidly
- New York will be #4 for quite a while
- 11 of the worst 15 states are red states
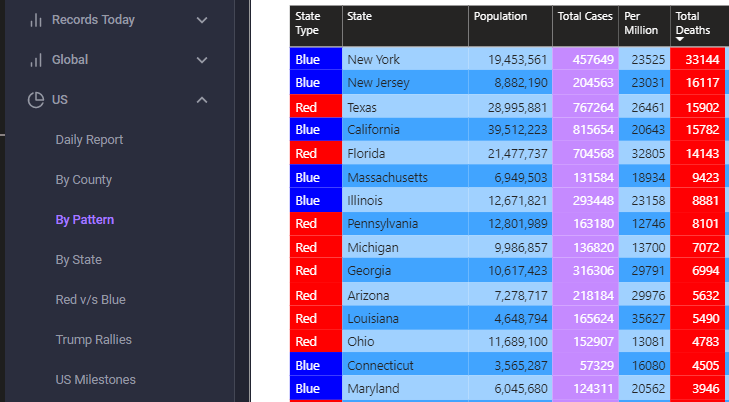
States with the Highest Number of deaths
- NY is well in front. They were the first to get hit when not much was known of the disease.
- NJ, FL, TX, CA will be in the top 5 for a while
- 8 of the worst 15 states are Red states
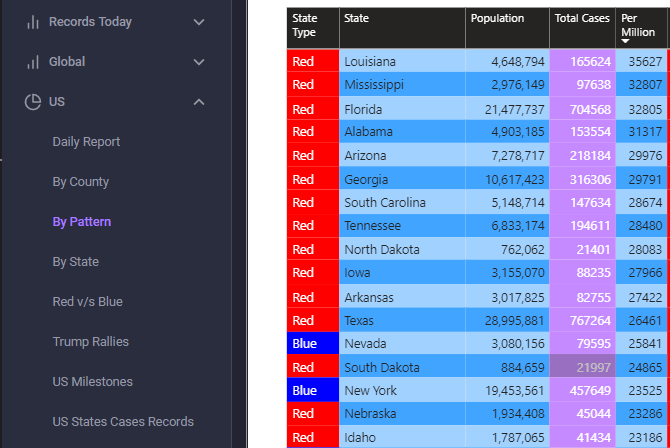
Worst performing states by cases per million
- The worst 12 states are all Red states
- Only 2 of the top 15 are blue states - NV and NY
- The Sturgis effect can be seen here - SD and some of its neighboring states or states close by have surged into the top 15 -- SD, ND, IA, NE, ID are in the top 15
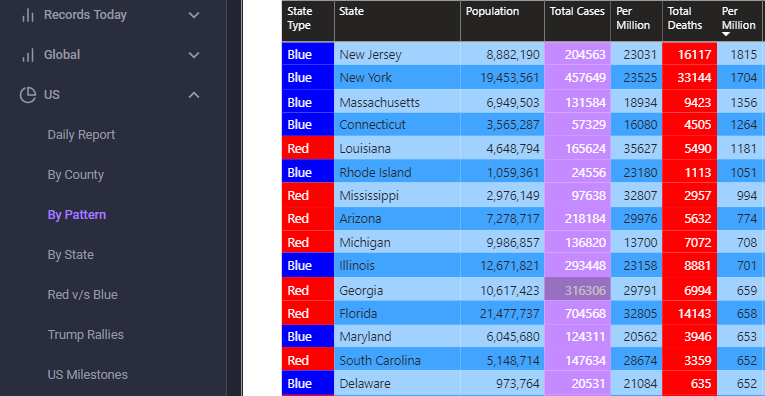
Worst performing states by deaths per Million
- Four Blue States at the top here and won't be budging for a While
- 8 of the worst 15 states are Blue states
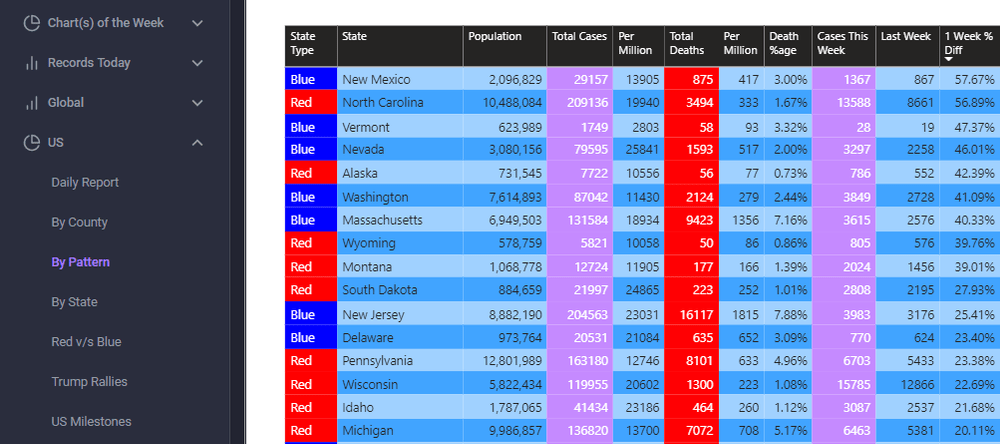
Worst performing states by 1 week case growth
- Lists all states with a 20% or higher weekly case growth
- 7 Blue states and 9 Red states
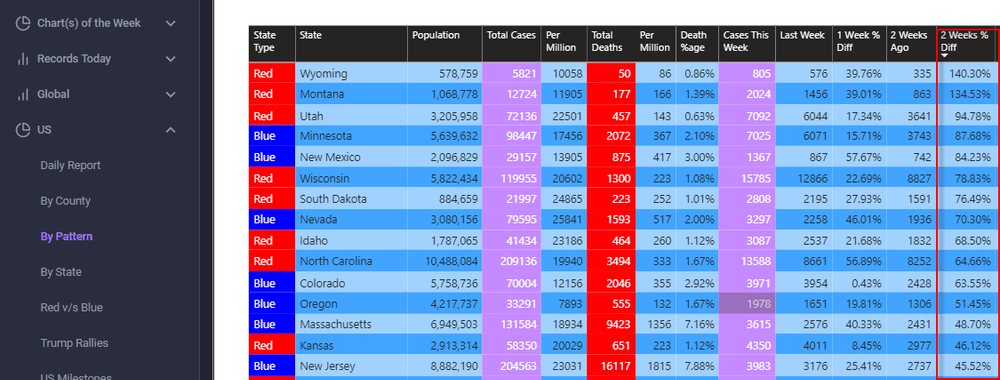
Worst performing states by 2 weeks case growth
- Lists all states with a 45% or higher case growth
- 7 Blue states and 8 Red states (most of the red states are here because of the Sturgis effect - WY, MT, UT, WI, SD, ID, KS)
Worst performing states by 4 weeks case growth
- Lists all states with a 100% or higher case growth
- 1 Blue state and 4 Red states (all 4 red states are here because of the Sturgis effect)

Final Thoughts
- The gap between the Blue states and Red states in cases per million will keep increasing, especially if the Red States remain adamant about not enforcing masks and practising social distancing.
- The gap between the Red states and Blue states in deaths per million will keep narrowing.
- The 1, 2, 4 week trend shows that the Blue state cases and deaths are growing, just not as strongly as in the Red states.
- Not having a national strategy doesn't help. The cases can spread from the Red states back to the Blue states and vice versa.
- Israel had flattened the curve and then they re-opened the schools. The cases in Israel exploded soon after. The peak of the first wave before schools re-opened, now looks like a blip on the Israel cases chart.
- Since the US re-opened schools and colleges with the 25 or so southern Republican Governors not having the guts to say no to Trump, things will get much much worse. 100,000 cases daily and 2,500 deaths daily (625 Benghazis daily) will be a common occurrence in fall / winter and the flu season.
Israelis Fear Schools Reopened Too Soon as Covid-19 Cases Climb
