Enhancements to COVID Data Analytics Site Week of July 6th:
US Charts / Visualizations
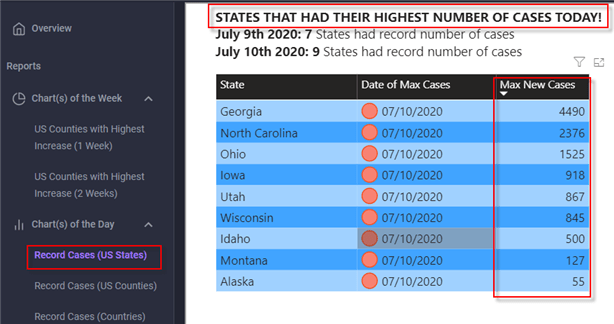
- Added a table that shows the US States setting a record today for maximum daily cases for that state
https://corona-virus.dev/app/reports/cvus/cvuRecordCasesStates
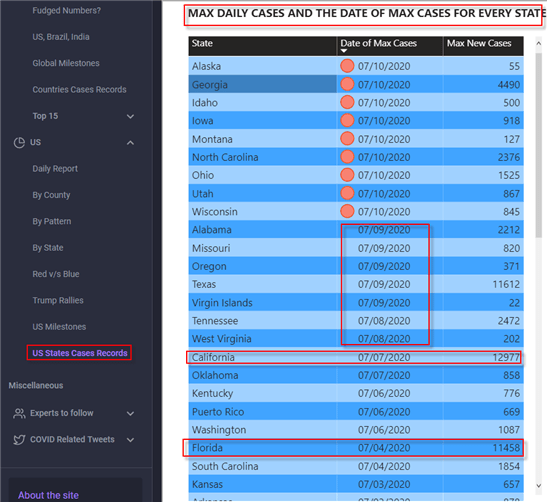
- Added a table that shows all of the US States (and Union Territories) and the max daily cases for that state and the date that record was set
https://corona-virus.dev/app/reports/cvus/cvuAllCasesStates
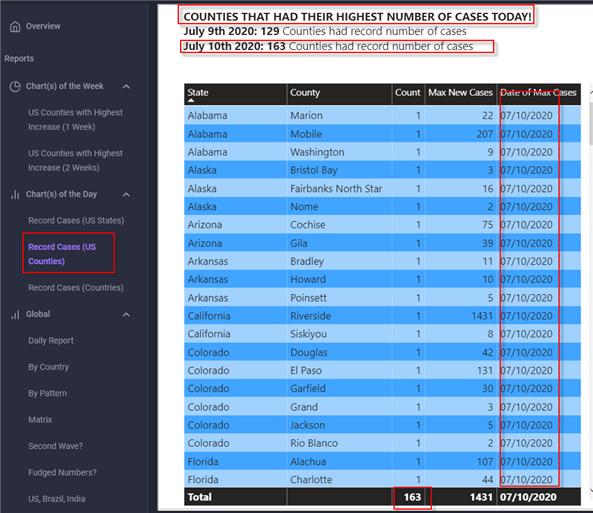
- Added a table that shows all of the US Counties setting a record today for the max daily cases for that county
https://corona-virus.dev/app/reports/cvus/cvuRecordCasesCounties
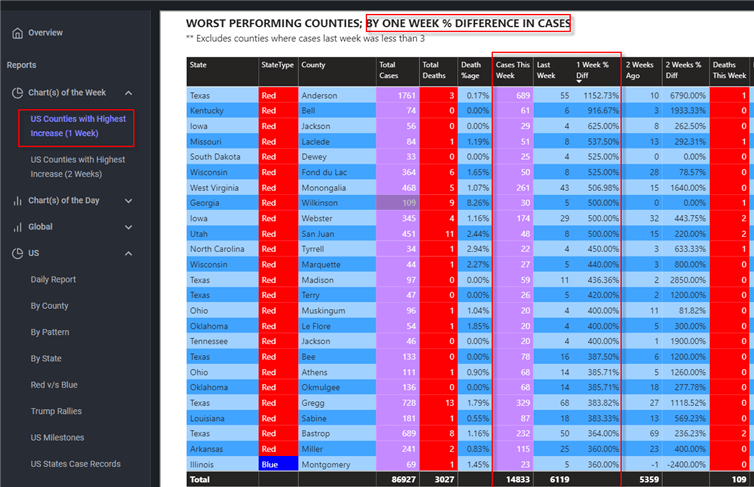
- Added a table that shows all of the the worst performing counties -- by the largest % difference in weekly cases when compared to cases last week
https://corona-virus.dev/app/reports/cvus/cvuOneWeekCases
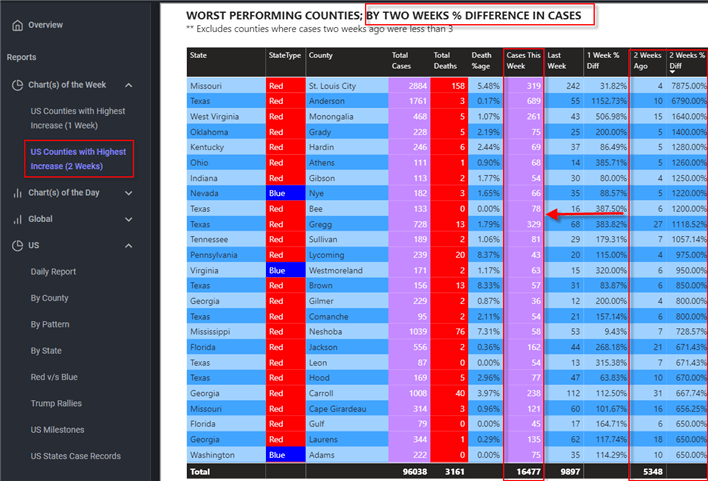
- Added a table that shows all of the worst performing counties -- by the largest % difference in weekly cases when compared to cases two weeks ago
https://corona-virus.dev/app/reports/cvus/cvuTwoWeekCases
Global Charts / Visualizations
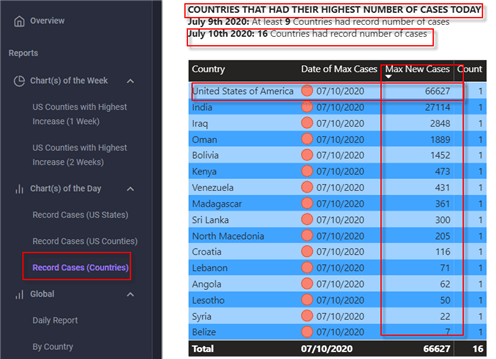
- Added a table that shows the Countries setting a record today for maximum daily cases for that country.
https://corona-virus.dev/app/reports/cvglobal/cvgRecordCasesCountries
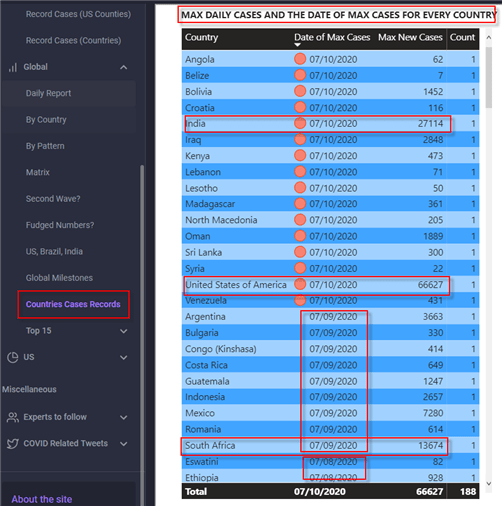
- Added a table that shows all of the Countries and the max daily cases for that country and the date that record was set.
https://corona-virus.dev/app/reports/cvglobal/cvgAllCasesCountries
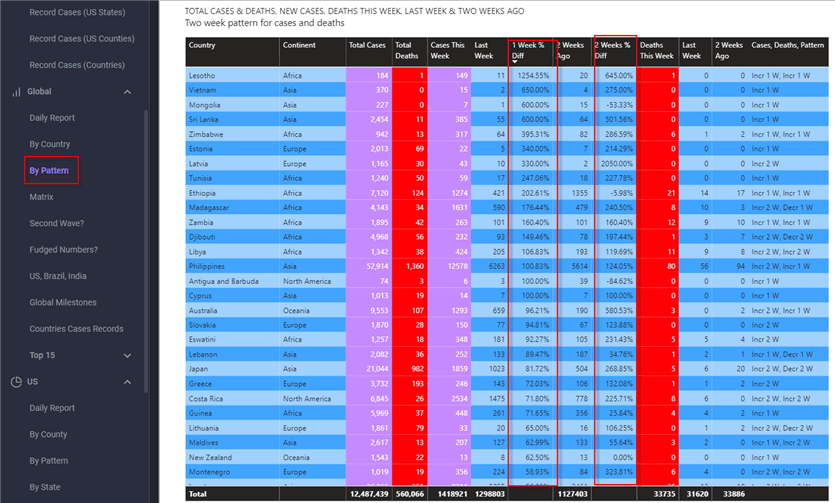
- Modified the Global Pattern table to include the % difference in weekly cases when compared to cases last week and two weeks ago.
https://corona-virus.dev/app/reports/cvglobal/cvgpattern
